Zimbabwe does not have a national minimum wage but rather sectoral minimum wages in the private sector. In the public sector, the minimum wages are determined by the Civil Service Commission and the Government. Thus, ultimately, there exists two different systems of collective bargaining (CB) and wage determination in Zimbabwe, one for the public sector and the other for private sector as shall be discussed in this paper.
1.1 Collective Bargaining in the Public Sector - Wage Determination Process in the Public Sector
Section 20 (1) of the Public Service Act states that the Civil Service Commission (CSC) shall be engaged in regular consultations with recognized Public Service Associations with regards to the conditions of service. According to the Public Service Act the role of the associations ends with consultation alone, meaning the associations do not have the final say in terms of the actual salaries and allowances paid to civil servants. The final say on salaries, allowances and benefits, according to Section 203 (4) of the Zimbabwean Constitution rests with the President. Section 203 (4) states that in fixing the salaries, allowances and other benefits of the civil service, the CSC must act with approval of the President given on the recommendation of the responsible Minister for Finance in consultation with the Minister responsible for the Public Service. Following the directive of the President, the CSC can then enter into any agreement with the employees.
Clearly, this means that there is no effective collective bargaining in the public sector since the role of the CSC ends with consultation alone and they do not have the final say in terms of the final outcome of salaries and allowances for public sector wages. This means workers in the public sector do not have the right to collective bargaining since they are forced to accept what is finally determined by the President.
1.2 Collective Bargaining in the Private sector
Collective bargaining for all workers in the private sector and state enterprises (parastatals) is governed by the Labour Act (Chapter 28:01). Section 74 (2) indicates that trade unions and employers and employers’ organisation may negotiate CBAs on any conditions of employment which are of mutual interest to the parties. Section 74 (3) (a) makes a provision for negotiating rates of remuneration and minimum wages for the different grades and types of occupations. This means that the workers and the employers can negotiate and agree on any issue as long as it relates to conditions of employment.
In this regard, sectoral National Employment Councils (NECs) were established to determine sectoral wages which are legally binding to all employers and employees falling within the scope of the sector or industry, irrespective of whether the employers or employees belong to the respective trade union or employers’ association. The NECs comprises of equal representatives of employers drawn from a registered employers’ organization or federation of employers’ on one hand, and representatives of employees drawn from a registered trade union or federation of trade unions. The NECs play a critical role in Zimbabwe’s industrial relations and social dialogue. Some NECs also administer their own medical and pension schemes for their specific sector. Table 1 shows the trends in sectoral CBA outcomes concluded at sectoral NECs between 2011 and 2016.
Table 1: Trends in Wage Bargaining Outcomes ($), 2011-2016
|
Trade Union |
2011 |
2012 |
2013 |
2014 |
2015 |
2016 (Sept) |
|
Agriculture -Gen Agric |
59 |
59 |
65 |
72 |
72 |
72 |
|
Agric - Kapenta |
N/A |
N/A |
N/A |
135 |
135 |
135 |
|
Agric - Horticulture |
N/A |
N/A |
N/A |
82 |
82 |
82 |
|
Agric - Timber |
N/A |
N/A |
150 |
150 |
150 |
150 |
|
Agric – Tea/Coffee |
N/A |
N/A |
95 |
95 |
95 |
95 |
|
Baking |
183 |
196 |
230 |
235 |
241.74 (excl. allowances) 349.46 (incl. allowances) |
241.74 (excl. allowances) 349.46 (incl. allowances) **add 2% on basic & housing awarded by arbitrator in Sept 2016 but yet to be registered) |
|
Banking |
575.9 |
633.49 |
633.49 |
636 |
636 |
636 |
|
Cement and Lime |
271 |
298.1 |
314.5 |
264 (Fibre), 315 (Cement) |
Deadlocked |
Deadlocked |
|
Clothing |
147 |
155.09 |
166.57 |
166 |
Still in progress |
Still in progress |
|
Construction |
223.52 |
258.72 |
276.32 |
310.76 |
310.76 |
310.76 |
|
Ceramic & Allied |
N/A |
N/A |
N/A |
N/A |
N/A |
200 – May 2016 |
|
Detergents, Edible Oils and Fats |
178 |
192.24 |
202.81 |
207.88 366 (incl. allowances) |
207.88 366 (incl. allowances) |
207.88 366 (incl. allowances) |
|
Engineering |
200 |
240 |
270 |
275.4 |
275.4 |
|
|
Energy (ESWUZ) |
N/A |
222 (excl. allowances) 324 (incl. allowances) |
222 (excl. allowances) 324 (incl. allowances) |
222 (excl. allowances)
324 (incl. allowances) |
222 (excl. allowances) 324 (incl. allowances) |
222 (excl. allowances)
324 (incl. allowances) |
|
Energy (NEWUZ) |
N/A |
275 |
275 |
275 |
275 |
275 |
|
Food Processing |
220 |
242.35 |
256.89 (exc. Allowances) 346.89 (incl. allowances) |
256.89 (exc. Allowances) 346.89 (incl. allowances) |
256.89 (exc. Allowances) 346.89 (incl. allowances) |
256.89 (exc. Allowances)
346.89 (incl. allowances) |
|
Hotel and Catering |
175 |
175 |
186 |
200 (excl. allowances) 275 (incl. allowances) |
200 (excl. allowances) 275 (incl. allowances) |
200 (excl. allowances) 275 (incl. allowances) |
|
Meat, Fish, Poultry and Abattoir Processors |
182.01 |
200 |
223 |
223 |
227 (excl. allowances) 336 (incl. allowances) |
227 (excl. allowances) 336 (incl. allowances) |
|
Music & Arts |
N/A |
N/A |
N/A |
N/A |
N/A |
N/A |
|
Metal and Allied (merged in 2014) |
N/A |
N/A |
N/A |
Ferro Alloys 250 Electronic – 289.50 Automotive – 272.40 Motor manufacturing - 280 |
Ferro Alloys 250 Electronic – 289.50 Automotive – 272.40 Motor manufacturing - 280 |
Ferro Alloys 250 Electronic – 289.50 Automotive – 272.40 Motor manufacturing - 280 |
|
Railways - RAE |
361.18 |
361.18 |
361.18 |
361.18 |
361.18 |
361.18 |
|
Railways - RAU |
562.7 |
562.7 |
562.7 |
171.90 |
Deadlock/Nil |
Deadlock/Nil |
|
Railways - RAYOS |
172 |
172 |
172 |
172 |
172 |
172 |
|
Railways - ZARWU |
260 |
260 - Deadlock |
260 - Deadlock |
260 - Deadlock |
260 - Deadlock |
260 - Deadlock |
|
Security Guards |
200 |
200 |
241 (excl. allowances) 236 (incl. allowances) plus 1 bar soap every month and 50mls shoe polish after every 2 months |
241 (excl. allowances) 236 (incl. allowances) plus 1 bar soap every month and 50mls shoe polish after every 2 months |
241 (excl. allowances)
236 (incl. allowances) plus 1 bar soap every month and 50mls shoe polish after every 2 months |
241 (excl. allowances)
236 (incl. allowances) plus 1 bar soap every month and 50mls shoe polish after every 2 months
|
|
Soft Drinks |
188 |
211 |
237 |
241.74 |
241.74 (excl. allowances) 336.75 (incl. allowances) |
241.74 (excl. allowances) 336.75 (incl. allowances) |
|
Textile |
150 |
173 |
182.08 |
182.08 |
182.08 |
182.08 |
|
Tobacco |
229 |
254 |
273 |
294 (Processing), 214 (grading) |
Processing (301), Manufacturing (347), Grading (201) |
Processing (301), Manufacturing (347), Grading (201) |
|
Transport |
180 |
266 |
266 |
266 |
266 |
266 |
|
Urban Councils |
150 |
170 |
190 |
180 |
180 |
180 |
|
Education and Scientific - NGO |
N/A |
288 |
321 |
321 - Deadlock |
321 - Deadlock |
321 – Deadlock |
|
Education and Scientific –Machines |
|
|
255 |
255 - Deadlock |
255 - Deadlock |
255 - Deadlock |
Source: LEDRIZ, 2015 CBA Audit Report & Primary data collection
Table 1 clearly shows that the collective bargaining environment has been deteriorating since 2011 mainly due to the continued economic decline. Table 1 indicates that whilst in 2012, a total of 14 unions realised wage increases ranging between 6% to 22%, the number of unions with wage increases declined significantly from 14 to 3 by 2015 and the percentage range increase also declined to between 2% and 3% increase. The number of unions with unresolved (deadlocks or still in progress) wage negotiations increased from 9 in 2014 to 14 in 2015.This clearly indicates the most unions and workers have been losing out in wage negotiations depriving them of decent working conditions.
2. Sectoral Minimum Wages versus the Cost of Living
2.1 Comparison between Private, Public, Municipal, Parastatal and NGOs wages
In the context of Zimbabwe, the living wage is equivalent to the Poverty Datum Line (PDL). PDL is the minimum amount of money required by a family of 5 in order to meet the minimum basic requirements of life per month. Table 2 shows a comparative analysis of the various sector average monthly wages vis a vis the Poverty Datum Line (PDL).
Table 2: Average Monthly Earnings, Poverty Lines and Per Capita Income
|
2009 |
2010 |
2011 |
2012 |
2013 |
2014 |
|
|
Private Wage |
120 |
146 |
200 |
250 |
280 |
340 |
|
Public Wage |
182 |
306 |
342 |
394 |
446 |
478 |
|
Municipal Wage |
240 |
315 |
468 |
500 |
560 |
620 |
|
Parastatal Wage |
280 |
346 |
415 |
478 |
535 |
600 |
|
NGOs Wage |
420 |
466 |
500 |
544 |
638 |
735 |
|
Food Poverty Line-FPL |
136.9 |
145.07 |
148.56 |
167.64 |
159.62 |
157.49 |
|
Poverty Datum Line-PDL |
453.38 |
476.37 |
485.75 |
543.3 |
503.81 |
505.99 |
|
Private Wage/PDL (%) |
26.5 |
30.6 |
41.2 |
46 |
55.6 |
67.2 |
|
Public Wage/PDL (%) |
40.1 |
64.2 |
70.4 |
72.5 |
88.5 |
94.5 |
|
Municipal Wage/PDL (%) |
52.9 |
66.1 |
96.3 |
92 |
111.2 |
122.5 |
|
Parastatal Wage/PDL (%) |
61.8 |
72.6 |
85.4 |
88 |
106.2 |
118.6 |
|
NGOs Wage/PDL (%) |
92.6 |
97.8 |
102.9 |
100.1 |
126.6 |
145.3 |
Source: LEDRIZ, 2015.
Table 2 shows that between 2009 and 2014, wages in the private sector have continued to lag behind other sector wages, leaving workers in the private sector the least paid and worse off than their counterparts in other sectors. Over the given period, the highest average minimum wage was in the NGO sector, followed by municipal, parastatal, public and private sector in that order. Whilst all average minimum sector wages have remained above the FPL, most have failed to be at par with the PDL. Both public and private sector wages have failed to reach the PDL level for the given period save for NGOs wages and municipal and parastatal wages between 2013 and 2014. This means that the rest of the workers earning less than the living wage (PDL) makes them poor.
2.2 The Private Sector: A sectoral analysis
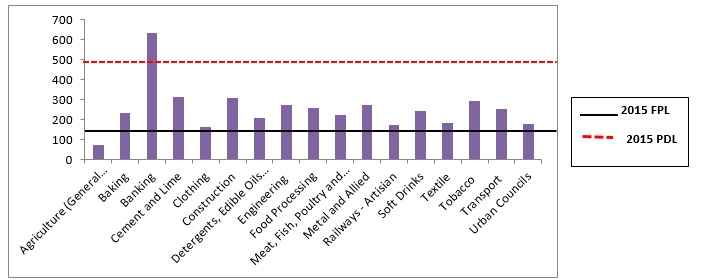
Figure 1 shows the sectoral minimum wages of 2015 versus the 2015 FPL and PDL. The FPL for 2014 was USD157 before declining slightly to USD156 in 2015. On the other hand, the PDL for 2014 was pegged at USD506 before declining slightly to USD491 in 2015.
Figure 1: 2014/15 Sectoral minimum wages versus 2015 FPL and PDL
Source: LEDRIZ 2015 CBA Audit Report & Database
Figure 1 shows a saddening picture of the state of most workers in Zimbabwe where the sectoral minimum wages have failed to be more or at par with the PDL. Whilst most of the sectoral minimum wages except general agriculture were able to meet the FPL, the majority of the sectors could not meet the PDL except for the banking sector. Using Table 3 below, the analysis revealed that agriculture sector workers are classified as totally poor. The majority of the workers are in the “poor” category whilst the banking sector workers are regarded as non-poor. Poverty wages are a sign of decent work deficits.
Table 3: Classification of households by income
|
Household Description |
Status Classification |
|
Households whose expenditure per capita cannot meet basic food requirements |
Very poor |
|
Households whose monthly expenditure per capita is equal to the Food Poverty |
Poor |
|
Households monthly expenditure per capita is equal or above the TCPL |
Non-poor |
|
Households whose incomes are below the FPL |
Totally poor (the very poor and poor combined). |
Using Figure 1 and Table 2, it clearly shows that wages in the private sector in Zimbabwe have failed to lift workers out of poverty, ranking them the “working poor” according to the ILO standards. This poverty situation in the labour market, is also a reflection of the overall national poverty situation as illustrated in Table 4.
Table 4: Household and Individual Measured Prevalence of Poverty (%): 2011 /12
Source: ZimStat, 2013- Poverty and Poverty Analysis in Zimbabwe, 2011/13
Using the per capita consumption expenditure approach to measure poverty incidence in Zimbabwe, the Poverty, Income, Consumption, Expenditure, Survey (PICES) of 2011/12 period observed that 62.6 percent of Zimbabwean households were poor, whilst 16.2 percent of the households lived in extreme poverty; 72.3 percent of Zimbabweans (individuals) were poor while 22.9 lived in extreme poverty. Rural poverty (individuals) in particular was 84.3 percent. Comparing with the SADC level and Sub-Saharan level shows that Zimbabwe is far worse. For instance, the 72.3 percent the level of poverty in Zimbabwe was way above the Sub-Saharan average of 46.9 per cent and the SADC level of 45 per cent in 2011 respectively. The PICES (2011/12) showed that as a result of the low incomes, households in Zimbabwe were selling financial assets more than they were buying them, suggesting a dissaving scenario to fund current expenditures since incomes fall short of current consumption expenditures.
2.3 Wage differentials between Management and Ordinary Workers in Selected Parastatals
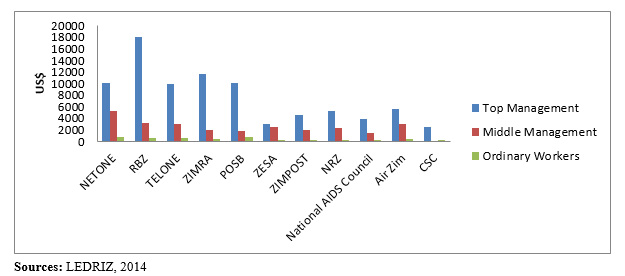
In 2014, LEDRIZ conducted a survey on wage differentials between management and ordinary workers. The results are reflected in Figure 2.
Figure 2: Basic Salaries (per month), selected parastatals
Figure 2 shows that by 2014, there were huge income disparities between top management and middle management, top management and ordinary workers, and between middle management and ordinary workers within most enterprises. The gap is smaller between middle management and ordinary workers showing that the CEOs are the ones benefitting a lot from these ailing state-controlled enterprises at the expense of ordinary workers. Since then, the income disparities between the highest and lowest paid have continued to widen reflecting the different ways of determining the levels with collective bargaining at the lower echelons and entitlement-based contracts at the top. The irony in the parastatals is that employers pay high salaries, packages and benefits at the top management level but bemoan the inability to pay wages for the lower echelon workers. In view of this, there is an urgent need for the creation of an equitable earnings structure that ensures that all workers earn a decent and living wage as well as adjusting and maintaining the minimum wage for workers in line with the PDL.
3. Emerging issues: Non-payment of wages and salaries
One of the most daunting and emerging challenge for workers between 2014 and 2016 has been the non-payment of salaries by employers especially in the private sector. Non-payment of wages and salaries in this case refers to unpaid workers, no wage, no package, partially paid workers, laid off and with no package workers.
Whilst non-payment of wages started in earnest in 2012 due to the deteriorating economic environment, the rate escalated in the period 2014 to 2016. During 2012, both parastatal and private-sector companies began to lag on payment of wages citing viability challenges. At first, many companies started paying wages very late in the month, with some paying during the first or second week of the following month. Some companies only managed to pay half the wage or salary due. By the beginning of 2013, the situation had worsened as some companies completely failed to pay wages and salaries, citing cash-flow and liquidity problems. However, workers were still expected to come to work, even when their wages or salaries were in arrears Thus, the number of workers who were receiving partial paychecks or no wages at all grew. In addition, many workers who were laid off frequently did not receive back wages. Others have received back wages, but not the agreed employment termination packages they were due.
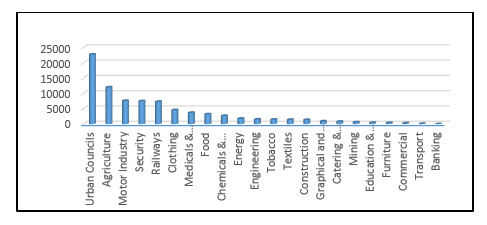
In addition, a survey by LEDRIZ and Solidarity Centre (2015) based on 442 companies indicated that a total of 82,776 workers were affected by non-payment (wage theft) in 2015. Figure 3 shows the sectoral distribution of non-payment of salaries in 2015.
Figure 3: Sectoral distribution of workers affected by non-payment of wages and salaries, 2015
Source: Wage Theft Survey (Solidarity Centre/LEDRIZ), 2015
According to Figure 3, the top ten sectors affected by wage theft were urban councils (22,228), agriculture (12,034), motor industry (7,622), security (7,514) and railways (7,354). The least affected was the banking sector with 10 workers at one company. Non-payment of salaries has further reduced workers in Zimbabwe to the category of “working poor”.
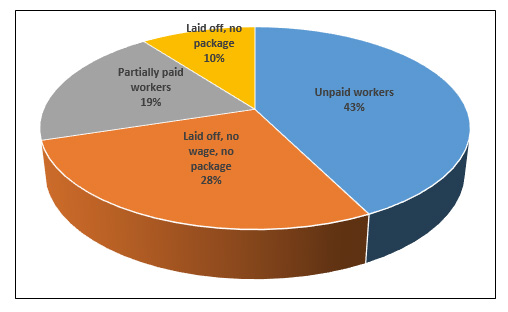
The survey also categorised non-payment of wages according to unpaid workers, no wage, no package, partially paid workers, laid off and with no package as shown in Figure 4.
Figure 4: Categories of Non-Payment of Wages
Source: LEDRIZ/Solidarity Research, 2015
Figure 4 indicates that the highest number of workers facing non-payment of wages fell in the category unpaid workers. This was followed by those who were laid off with neither a wage no package (28%). The third category were those workers who were partially paid (19%), with the least category being those workers laid off with no package (10%). Worryingly is that with this unbearable wage situation, workers were still required to report to work, failure to which termination of employment applied. Due to lack of alternative employment in a crisis-stricken country, workers are left with no choice but to find ways of reporting for work despite the non-payment of wages.
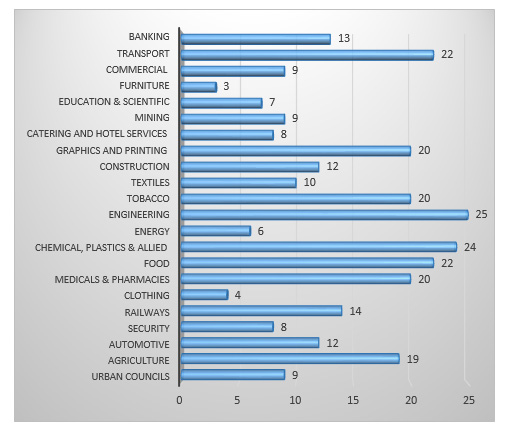
The same survey revealed that non-payment of wages and salaries averaged between 3 and 25 months across sectors as indicated in Figure 5.
Figure 5: Average Number of Months Unpaid
Source: Wage Theft Survey (Solidarity Centre/LEDRIZ), 2015
Figure 5 shows that the worst affected sectors with the highest number of months of non-paid wages were engineering, chemicals and plastics, transport, food, graphical and printing, tobacco, medicals and pharmacies and agriculture. The least affected sectors were furniture, energy and clothing. Non-payment of wages and salaries is a clear indicator of decent work deficits. It has resulted in poor worker morale and increased shirking and moonlighting by workers. All this has the effect of undermining worker productivity at their main workplaces.
Furthermore, non-payment of wages and salaries is a clear violation of a worker’s right as stipulated in Article 12 (1) of the ILO Convention on Protection of Wages Convention, 1949 (No. 95) which states that:
Wages shall be paid regularly. Except where other appropriate arrangements exist which ensure the payment of wages at regular intervals, the intervals for the payment of wages shall be prescribed by national laws or regulations or fixed by collective agreement or arbitration award.
4. Collective Bargaining Challenges
Table 5 indicates some of the challenges in collective bargaining emanating from the government side, employers side and trade union side.
Table 5: Challenges to collective bargaining and attainment of decent work
|
Government and Political factors |
Challenges from the employers |
Trade Union Challenges |
|
|
|
Source: LEDRIZ 2015 CBA Audit Report
5. Recommendations
- Harmonisation of the various Public Service Acts with the main Labour Act to ensure that public sector workers fully enjoy workers ‘rights including collective bargaining rights;
- Resuscitation of the national of national tripartite meetings through the Tripartite Negotiation Forum (TNF) composing of Government, Business and Labour. The TNF should deal with the volatile macroeconomic environment which is in turn affecting the collective bargaining environment, processes and outcomes including non-payment of wages and salaries;
- Domestication and effective implementation of the of the ILO Convention on Protection of Wages Convention, 1949 (No. 95) to deal with the issue of wage theft;
- Restoration of the basic requirements of social dialogue at national and NEC level which includes:
- Recognition of the right of workers and employers to associate freely and to establish organizations of their own choosing;
- Strong, independent, representative and democratic workers’ and employers’ organizations, having knowledge of key issues;
- Access to and effective involvement in social dialogue institutions and processes and the capacity to influence social and economic discussions.
- Government creating an enabling policy, legislative and institutional environment;
- An environment which includes effective machinery and mechanisms to facilitate and promote collective bargaining, prevent, manage and resolve labour disputes, and enforce laws and regulations through labour inspection and the judicial system.
- Continued strengthening of trade union negotiators through capacity development (education and training) given the massive deindustrialization taking place, high staff turnover in companies, and loss of trained negotiation cadres.
- An integrative approach to collective bargaining which takes into account both internal and external factors in order to come up with a win-win scenario in collective bargaining outcomes.
- Inclusion of non-wage benefits in collective bargaining that promote decent work elements such as medical aid, paternity leave, personal protective clothing, HIV and AIDS programmes, food (canteen) provisions, industrial pensions, among others.
- Review of NECs role to move from just focusing on wage negotiations but to also focus on:
- human resource development;
- skills development;
- sectoral productivity and competitiveness;
- sectoral trend analysis, among others.

